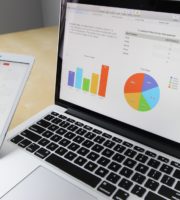
In the age where big data is everything to businesses, a lot of information is being gathered through data analysis. As a business leader, you must have a way to present that data to ensure easier interpretation. And that is where the concept of data visualization comes in. It provides a clear picture of what the information means through visual contexts such as graphs, charts, maps, and more. Meaningful information is easier to comprehend and can help identify trends, unexpected opportunities, patterns, and weaknesses. With that in mind, here are six ways data visualization technology can be used in the business world.
Boosting Operational Efficiency
Maximizing operational efficiency is one of the best ways companies can use to keep up with the competition. You can accomplish this by performing careful data analysis to gain helpful insights on production and other essential measures. For better results, you have to involve other factors such as technological innovation, streamlining processes, using metrics, and feedback from team members and customers. Continually utilizing these processes can enhance operational efficiency and keep your company geared to success.
Faster and Better Decisions
Naturally, the human brain tends to comprehend and process visual data much faster than written information. Visual representations like graphs and charts can summarize big and complex data to ensure faster processing of relationships and avoid clutter spreadsheets or reports. This offers clear ideas that allow companies to interpret and process their information faster and better. What is more, big data visualization tools like Microsoft Power BI, Qlik, and Oracle Visual Analyzer can help provide insights that are easier for business leaders to interpret.
Analyze Emerging Trends
Data visualization can also help track key indicators to identify market trends and shifts in large data sets. The data gathered on consumer behavior can unlock new opportunities for flexible companies. But this concept often requires business leaders to be consistent in collecting and analyzing the available data.
Communicate Findings in a Meaningful Way
In most cases, reports presented to top management are a punch of documents inflated with various chart types and static tables. Such information can be overwhelming to decision-makers and fail to make information more memorable and vibrant. Fortunately, using data visualization tools can help break complex data into a single and more operational graphic. This can help decision-makers interpret various data sources via more visualized and interactive elements such as charts and heat maps.
Gain Customer Insights
As the use of data evolves, companies are gaining access to essential consumer insights. Furthermore, it is estimated that companies will possess more than 180 trillion gigabytes of data by 2025. Businesses across various industries engage in massive data analysis to understand consumer behavior and know how people interact online. For instance, targeted digital ads are great tools that work based on algorithms to assess and predict human perception, interest, and behavior. Moreover, big data visualization can also expose real-time changes, encouraging users to explore and manipulate the data on time.
Helps Understand Relationships Between Operations and Results
Another excellent way business leaders can use their data visualization is by tracking the correlation between operations and business performance. Finding the connection between the overall business operation and market performance is crucial in a highly competitive environment. This can also help decision-makers learn new market developments to develop robust strategies to help stay ahead of the competition. For example, a sales director of a cloud software firm may notice instantly in a graph that their sales of a particular product line are down ten percent in the Northern region. The company can then track down to identify possible variances before formulating a viable plan.


